In 2004, Kerry lost 51-48. Yesterday, Obama won 52-46. Thats a net shift of 9 points.
But the shift was not geographically uniform. In the graph below, which I stole from Krugman, shades of blue correspond to shifts towards democrats relative to 2004 while shades of red correspond to shifts towards republicans.
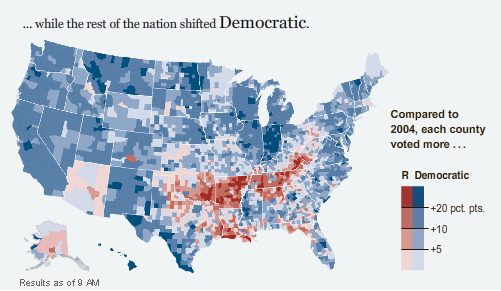
It seems in many places in the US actually experienced large shifts towards republicans - the dark red correspond to shifts of 20 percent or more.
How to explain this data?
The most puzzling thing about it is how the divisions cut across the categories commonly used to think about politics. For example, we tend to think about Georgia, Mississippi, Tennessee, and Arkansas as being "southern" and hence similar politically, as far as distinct states can be politically similar anyway; but the first two experienced significant shifts towards the democrat whereas the latter two experiences significant shifts towards the republican.
There could be a simple explanation: the differences could simply reflect the efforts put in by the campaigns - perhaps Obama did not campaign, advertise, or moblize voters much in the red-shaded areas. I don't think this is the case; even among safe states for McCain, in which I don't see either McCain or Obama spending much effort, there are large differences.
To take a concrete examples, consider Mississpipi vs. Alabama vs. Tennessee. All three have always been shoo-ins for McCain. Yet Mississippi is covered in blue; it moved the same way as the rest of the nation. Alabama has a mixture of red and blue; and Tennessee is almost entirely covered in red, indicating a large shift in the opposite direction from the rest of the nation.
My guess is that these divisions could represent significant cultural cleavages which I have not seen anyone explain.
posted by alex @ 9:28 PM
0 comments
![]()
